
A few hours into one task, the month is gone.
Not the session. The month. A Max plan, one piece of work, and an allotment meant to carry weeks of it is spent.
So I stop. Whatever the work was, it is now less important than understanding what just happened.
And nothing I can see explains it.
This is the part I have never seen written down, so I will write it down. I could see that something was badly wrong. I could not see what. Everything available to me while I worked reported numbers that looked ordinary. Percentages, mostly green, none of them adding up to a plan exhausted in an afternoon. The instruments were not lying to me. They were answering a different question than the one I had.
I went looking properly, which meant measuring the session rather than glancing at it.
One session. Fifteen million, five hundred ninety-four thousand, five hundred fifty-seven tokens, across fifty-seven requests. Of that, 14,825,015 are cache reads. That is 95.1 percent.
Here is what that figure means and does not mean. Cache reads are the accumulated conversation being re-sent so the model can see it, and a large part of that is genuinely doing work, because the thread is the context. Underneath it sits a fixed amount that is re-sent every turn, is never used, and can be removed permanently. That underneath part is the whole story.
You are dragging memory you cannot see. A 2 KB file was pulling in a 57 KB one on every single turn, which is 14,740 tokens spent before my question was read at all. Across one session of 57 requests that is roughly 840,000 tokens I never chose to spend, an estimate because requests and turns are not strictly the same thing, and about 781,000 of them were removable permanently. It burns through your usage window faster than you expect, and you find out when the work stops.
The shape of it: about 260,000 tokens re-read on every turn, to produce about 1,200 tokens of reply. In one hour, 8,929,590 cache-read tokens. Thinking, the part I had assumed was expensive, is 34,016 tokens. Two tenths of one percent.
Then I look at the file.
My global CLAUDE.md is 2,106 bytes. About 526 tokens. By any reasonable standard, small. Line 9 of it is one line long:
@claude-lessons-learned.md
That file is 56,859 bytes.
Claude Code follows @ imports, five hops deep, and injects the result into every turn. The small file is a fifty-nine kilobyte file wearing a small coat. Fourteen thousand, seven hundred and forty tokens, paid before my question is even considered. On turn one. On turn twenty. On turn fifty-seven. For months.
CLAUDE.md is not loaded once at the start of a session and cached. It is re-read and re-injected every turn, and so is every file it imports. That is the context floor: the tokens you pay before anything useful happens. The arithmetic is unforgiving because it multiplies. A 14,740-token floor across a fifty-turn session is about 737,000 tokens spent re-reading the same nine rules, fifty times.
And it grew quietly. Sessions kept appending to that lessons file, one useful addition at a time. Nobody ever decided to make it 57 KB.
Which brings me to the part of this I actually want to write about.
I had already written a check for exactly this problem. Run it on the machine, get your per-turn overhead, act if it is large. I had run it. It reported ~/.claude/CLAUDE.md at 2,106 bytes, about 526 tokens, and it printed light, in green.
It was wrong for one reason. It sized the file. Claude Code loads the file plus everything the file imports, and my script did not follow imports.
So it was not broken in a way that produced an error. It was broken in a way that produced reassurance. A green light generated by the one thing the check could not see. An alarm that fails loudly is an inconvenience, because you notice it and you fix it. An alarm that fails quietly and tells you everything is fine is a different category of problem, and you cannot catch it by reading the output. The output looks right. You catch it only by asking what the check is structurally incapable of noticing.
The corrected audit, following imports:
=== Per-turn fixed context overhead ===
Estimated at 4 characters per token. Paid again on EVERY turn. @imports followed.

  ~/.claude/CLAUDE.md        2106 B  ~   526 tok  light
    ↳ @~/.claude/claude-lessons-learned.md  56859 B  ~ 14214 tok  heavy

  Fixed overhead per turn: ~14740 tokens
  over 50 turns that alone is ~737000 tokens
The ↳ line is the entire finding. One line of output that had never existed before.
The fix, which is not “delete the file”
The lessons file earns its place. It is the accumulated record of things that went wrong and should not go wrong again. Deleting it to save tokens would be trading a real safeguard for a cheaper session.
What it did not earn was being present on every turn.
So: keep the file, stop importing all of it. The import became a roughly 520-token extract — the handful of rules that must govern a session’s first action, before it can look anything up — plus one line saying where the full file is and to read it when a relevant topic comes up.
14,740 tokens per turn became 1,036.
That is one machine, one configuration, measured against Claude Code 2.1.269. Not a typical result and not a promise. Your number will be different, which is exactly why the useful thing to do is measure yours rather than believe mine.
The general rule that falls out of it: CLAUDE.md is for what a session must know before its first action. Everything else is something it can read on demand. Historical notes, resolved decisions, changelogs, long rationales — all of that is a file a session can open when it becomes relevant, and none of it needs to be in the room for every turn.
The second instrument
While I was in there, I found the other half of the problem, which is that none of this is visible while you work.
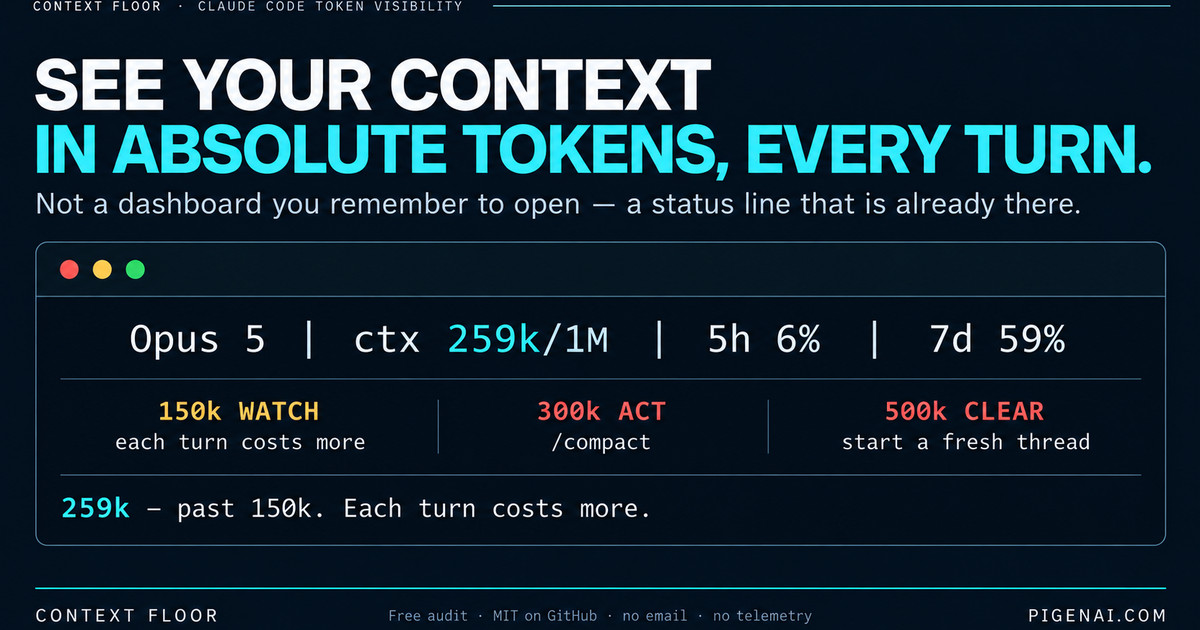
Claude Code pushes a status object to a script of your choosing on every turn. Reading it costs nothing — no prompt, no tokens, no asking Claude how much context it is using, which never worked anyway. It is a gauge rather than a report: always current, always in view, and it tells you your state now rather than summarising it later.
One thing to be plain about. This instruments Claude Code, in the terminal, and it does not reach a browser session. The five-hour and seven-day windows it reports are the same plan windows you can already see on claude.ai, because it is one shared pool. The reading that does not exist anywhere else is the first one: context in absolute tokens, on every turn, while you work.
Mine reads:
Opus 5 | ctx 377k/1M (38%) 300k+ · /clear or /compact | 5h 6% | 7d 59%
The first version showed ctx 38% and coloured it green, because 38% of a million-token window sounds fine.
It is not fine. Anthropic’s own usage panel flags anything over 150k context as the expensive zone. On a 1M window that is 15% — so a percentage-based warning shows green through the entire region where each additional turn is costing you meaningfully more. A warning system that reassures you at exactly the wrong moment is worse than no warning system, because you trust it.
So the thresholds are absolute now: green under 150k, amber at 150k, red at 300k, louder red at 500k. The percentage is still shown, demoted to a parenthetical, where it belongs.
The 5h and 7d figures are the subscription rate-limit windows, and I had assumed they were only available in a browser. They are in the same payload. That was the fifth thing I had asserted confidently and wrongly.
Six things I got wrong
I wrote all of this up first, then implemented it against the actual binary. Six claims did not survive contact:
statusLinewritten as a plain string. The CLI checksif (m.type !== "command") return. A bare string installs cleanly, prints no error, and does nothing. A false green, shipped by the document whose whole purpose was catching false greens.defaultModeat the top level. It lives atpermissions.defaultMode. My audit read the wrong path and printed a confident(not set).effortLevel: "medium"as a default. I recommended pinning reasoning depth globally. Then I measured: thinking was 34,016 tokens of 15,594,557 — 0.2%. Lowering answer quality on every session to save a rounding error is a bad trade. Withdrawn.- “No CLI source for remaining allotment.” Wrong, as above.
- Percentage context thresholds. Wrong unit entirely, as above.
- The audit not following
@imports. The one that hid the actual finding.
I am listing these because a tool that reconfigures your development environment should come from someone willing to publish their own errata. If I had shipped the first draft, every one of those six would have installed silently and looked like it worked.
If you are one developer
Be clear about what this does and does not buy you.
On Pro or Max, it does not lower a bill. Those are flat-rate. There is no per-token invoice to shrink, and anyone selling you token savings on a flat-rate plan is selling you something that is not true.
What it buys you is throughput. You pay in rate-limit windows instead of dollars, and removing 13,700 tokens of overhead per turn means more turns fit inside the same 5-hour and 7-day window. In practice that is the difference between finishing a piece of work and hitting a wall partway through it on a Wednesday afternoon.
The second thing it buys is not being surprised. Once the meters are in the status line, a limit stops arriving as an ambush.
If you are on the API, Console, Bedrock or Vertex, it is money, directly and measurably, because fixed overhead is billed on every single request. That is the one audience where a dollar figure is honest, and it is honest by a wide margin.
If you are a team
This is where it stops being housekeeping and starts being a real operational problem, for three reasons.
Drift is invisible and it is per-repository. Claude Code resolves the model through eight layers of precedence. A model key in one repository’s .claude/settings.json silently overrides every developer’s user-level setting, but only in that repo. Nobody gets an error. Nobody gets a warning. People just quietly get a different model than they think they are getting, in one project, indefinitely. /model typed in a session never persists, so the obvious fix — re-pick it — does nothing for the next session.
Fixed overhead is a per-seat multiplier. One developer’s 14,740-token floor is an annoyance. Ten developers, each running several sessions a day, is a standing line item that nobody has ever seen itemised, because no tool separates fixed per-turn overhead from session totals. The built-in usage panels show what you spent. They do not show what you re-paid.
CLAUDE.md files grow, and they grow fastest on the repositories people work hardest on. In the tree I audited, eleven repositories had a CLAUDE.md over 5,000 tokens. The largest was around 32,000. Nobody decided that. It accumulated, one useful addition at a time.
The practical shape of a fix for a team is not a policy document, it is a check that fails. The model audit exits non-zero when any layer disagrees, so it works as a weekly cron or a CI step rather than a cleanup somebody remembers to do. The context audit reports the number and flags it, and you decide what your ceiling is. Drift gets caught the week it appears instead of the quarter someone notices.
And there is a procurement-shaped benefit worth saying plainly: this produces a number. Not an impression that things feel slow, but a measured per-turn figure, before and after, that you can put in front of whoever approves the budget. Most of what gets said about AI tooling cost is vibes. This is arithmetic.
The scripts are free
Two of them, MIT-licensed, on GitHub:
claude-context-audit— sizes everyCLAUDE.mdthat loads into a session, following@imports recursively, and prints your fixed per-turn overhead and what it compounds to.claude-model-audit— reports the model across all eight precedence layers including every project-level pin, and exits non-zero if any of them disagree.
They read files and print. They write nothing, send nothing, and ask for no email address. Read them before you run them; they are short, and a tool that inspects your configuration should be one you can inspect yourself.
Run the context audit first. If your number is under a few thousand tokens, you are fine and you should go back to work. If it is not, the thing to look at is the ↳ lines.
The audits are the useful half and they are free. The full kit — a one-command installer for Windows, WSL, Linux and macOS, the status line with all three instruments, the runbook, and the browser-session playbook — is Context Floor, and it is paid. One mention, at the end, where it belongs.
Not affiliated with, endorsed by, or sponsored by Anthropic PBC. “Claude” and “Anthropic” are trademarks of their respective owners and are used here only to describe compatibility.